The high-latitude ionosphere is characterized by a strong electrodynamic
coupling with the magnetosphere.
High latitude plasma convection, field aligned currents and precipitation
of energetic particles are the most driving forces for very dynamic and
complex processes causing a large variability of the plasma density.
In particular enhancements of the solar wind energy generate large
perturbations in the high-latitude ionosphere and thermosphere that
commonly propagate towards lower latitudes.
So high latitudes are a kind of Space "weather kitchen" for numerous
perturbation phenomena observed in mid-latitudes.
The monitoring of the total ionization of this region may improve
our understanding of complex coupling processes between the solar
wind, magnetosphere, ionosphere and thermosphere.
In order to monitor the Northern high latitude ionosphere, we apply
the same procedure as used for monitoring the
European ionosphere.
A reliable data base is provided by about 30 GPS ground stations of
high the latitude GPS network of the International
GPS Service (IGS).
The GPS data provide the total electron content (TEC) of the ionosphere
along active radio links between GPS satellites and ground receivers.
These slant TEC data are converted to vertical TEC maps over the entire
Northern polar cap at latitudes phi > 50°N with a time resolution
of up to 10 minutes in our routine processing mode.
To ensure the reliability of the generated TEC maps we have developed
a polar TEC model (NTCMP-1) that - working as a background model - is combined
with numerous actual observations by a weighting procedure.
This assimilation technique has been successfully applied on the routine
generation of TEC maps over the European area since 1995. Nevertheless,
further validation work is needed, indicating that the routinely produced
TEC maps have still an experimental status.
If you need assessments of the accuracy or reliability of special events,
please contact us .
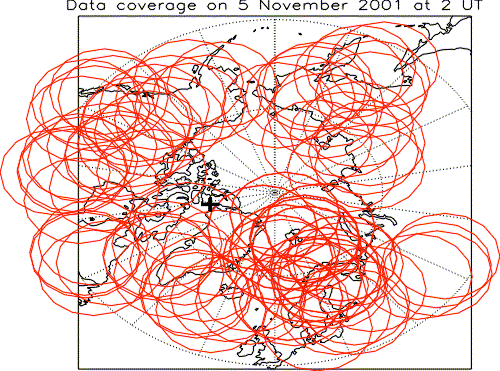
Although the data coverage is permanently changing, the figure
illustrates a typical situation (100 measurements) by plotting the
half width of the weighting functions constructed around each sub- ionospheric
point.
Vertical TEC values are computed for a grid that consists of
768 grid points within the latitude range 50 °< phi < 90°N
enabling the imaging of large scale perturbations in the auroral zone.
Coverage on 11 November 2001, 2:00 UT