
The data as displayed in the GIVD/GIVE maps are derived by means of a GNSS receiver capable of handling the ESTB/EGNOS augmentation signal and by means of some special EVnet client processor, for the decoding of the augmentation signal and the processing and transfer of the images to be displayed.
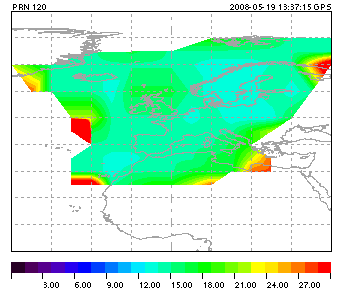
In Fig. 1 and Fig. 2 GIVD- and GIVE-maps in the EGNOS ionospheric monitoring area (lat. 0°-90° and lon.-40°-40°) as extracted from the ESTB or EGNOS augmentation data (Msg.18, 26) are displayed. To provide the vertical error, the interpolation of the data was done on the basis of the RTCA/DO-229C for 90° elevation. Notice that the scaling of the 24 step color scale may vary day by day. The quantization of GIVE is represented as transmitted by the system and given in the color scale of Fig 2. An indication off the GEO satellite number is given at the top left corner of the maps. A time stamp can be found at the top right. The light braun area indicates the region for which IPE measurements are announced in the message, but no (valid) data have been transmitted, however.
To compute the GIVD/GIVE in meters from the TEC as displayed in the maps, the following table may assist to rate the error for several satellite navigation bands.
| Ionospheric Propagation error (m) for TEC (TECU) | ||||||
|---|---|---|---|---|---|---|
| Band | f (MHz) | |||||
| 1 | 2 | 2,5 | 5 | 7,5 | ||
| GPS L1 | 1575,420 | 0,162 | 0,325 | 0,406 | 0,812 | 1,218 |
| GPS L2 | 1227,600 | 0,267 | 0,535 | 0,669 | 1,337 | 2,006 |
| Galileo E5a | 1176,450 | 0,291 | 0,582 | 0,728 | 1,456 | 2,184 |

In Fig.3, the structure for the processing of the ESTB ionospheric propagation error maps is sketched. The processing is based on the usage of the IKN Experimentation and Verification Network (EVnet).
The processor for the generation of the GIVD/GIVE IPE maps acts as a real-time client of the EVnet using the monitoring data of one (NCT2000D) of the GPS receivers operated at the IKN Neustrelitz EVnet monitoring station.